A game-by-game analysis of the Gophers Football schedule based on predictive models and game spreads

Unlike many new coaches, PJ Fleck is not coming into his new position as Head Coach with an empty cabinet, as the Gophers return most of their starters from a 9-4 team last year. However, determining what to expect from a record standpoint this year is difficult, especially given a new system will be in put in place and a new Quarterback will be learning on the job.

In the analysis below I take a look at the Gophers football schedule on a game-by-game basis based on two respected college football computer models and already-released game spreads.

The inputs:

People often roll their eyes at or ignore statistics-based approaches, but their accuracy can be validated using historical game-by-game results. For this analysis I used two respected, predictive football models: Bill Connely’s S&P and ESPN’s Football Power Index (FPI).

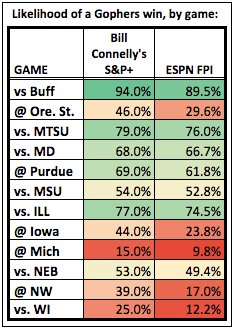
Bill Connelly has written an excellent preview of the Gophers 2017 season, and his win probabilities are included at the bottom. ESPN’s FPI win probabilities can be found here. I have summarized them below for quick reference:
img1
​​

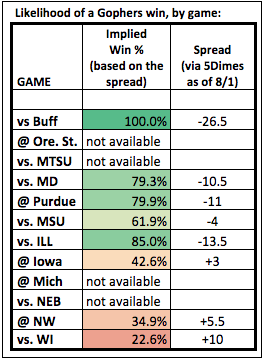
Further, Vegas spreads can be helpful in analyzing and setting preseason expectations. If a certain spread is “off” by more than a few points sharp bettors will put forward large bets until the spread shifts, thus becoming accurate. As of now spreads have been set for eight games this year.

Specific game spreads (via 5Dimes):
vs. Buffalo: – 26.5 (26.5 point favorite)
vs. Maryland: -10.5
@ Purdue: -11
vs. Michigan State: -4
vs. Illinois: -13.5
@ Iowa: +3
@ Northwestern: +5.5

vs. Wisconsin: +10

Based on the outcome of 17,000 games over multiple decades, spreads can be directly correlated to win probabilities. For example, six-point favorites win 66% of the time. Using the eight available spreads above I included the following win probabilities in my analysis, assuming that if the spreads were off by too much it would have adjusted already.
img2


The method:


Given the concepts outlined above, I took game-by-game win probabilities from Bill Connelly’s S&P and ESPN’s FPI and combined those win probabilities with Vegas spreads to analyze the likelihood of various season-long outcomes.

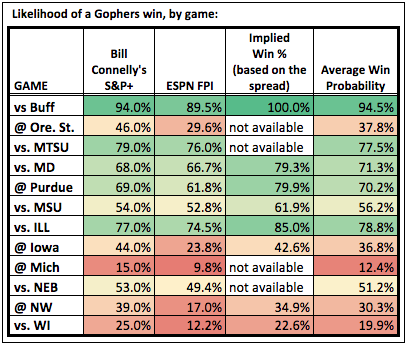
Specifically, I calculated an “Average Win Probability” for each game by averaging each game’s win probability per ESPN’s FPI, per Bill Connelly’s S&P and per the spread (if available). The results of this are shown in the image below:
img3
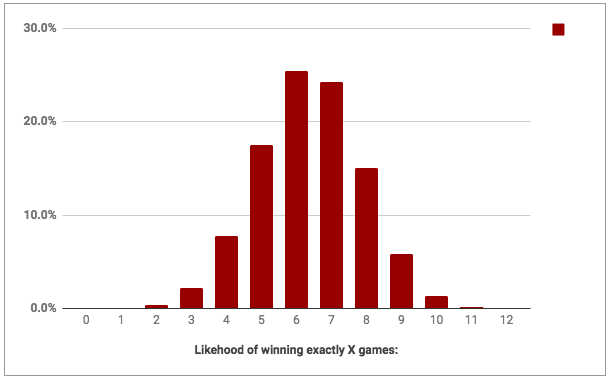
Using the Average Win Probability for each individual game I then calculated the likelihood of each season-long win/loss record.

The results:


img4

img5

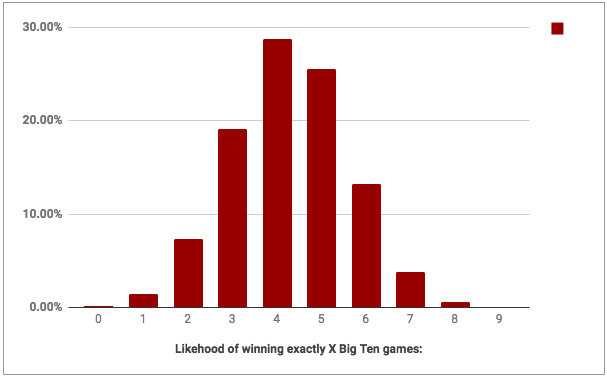
I then used the same approach to analyze the Big Ten portion of the schedule separately.

img6

img7

The takeaway:


To me the schedule can be broken down into three groups: should-be wins, toss ups and likely losses.

Should-be wins: Buffalo, vs. Middle Tennessee, vs. Maryland, at Purdue, vs. Illinois.

Toss ups: At Oregon State, vs. Michigan State, at Iowa, vs. Nebraska, at Northwestern.

Likely losses: At Michigan, vs. Wisconsin.

Whether this season can be labeled as a success will likely come down to the “toss up” games. For me, Big Ten play takes precedence over non-conference games, so the most important games on the schedule are Michigan State (projected to be down this year), Iowa and Nebraska.

Switch those three games to wins in the model and the Gophers likelihood of winning eight or more games jumps from 22% to 64%. And the likelihood of nine wins or more jumps from 7% to 33%.

Win two or three of the games and the Gophers should be competing for a Big Ten West title as they enter the final two games, at Northwestern and vs. Wisconsin.

However, with losses at Iowa and vs. Nebraska the Gophers will quickly find themselves out of contention and instead competing for bowl eligibility.

——–
Spreadsheet link for those curious:
Comparing B1G Football Season Ticket Prices: A Comprehensive Overview

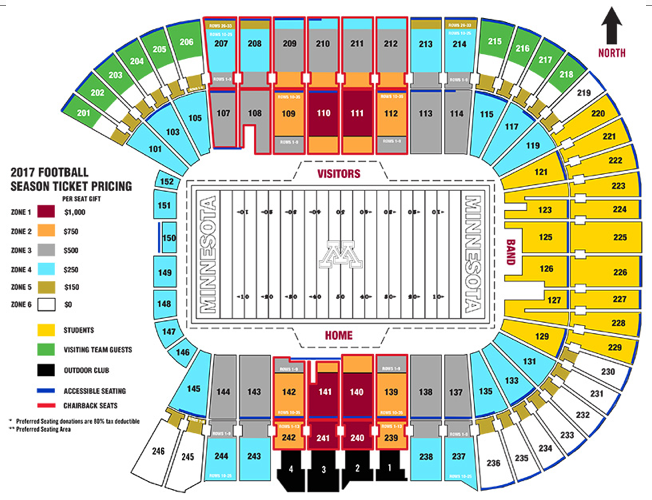
By now all Gophers Football season ticket holders are likely aware: prices are set to increase dramatically over the next three years. Here’s the big question: how will the new season ticket prices compare to the prices of football season tickets around the Big Ten?

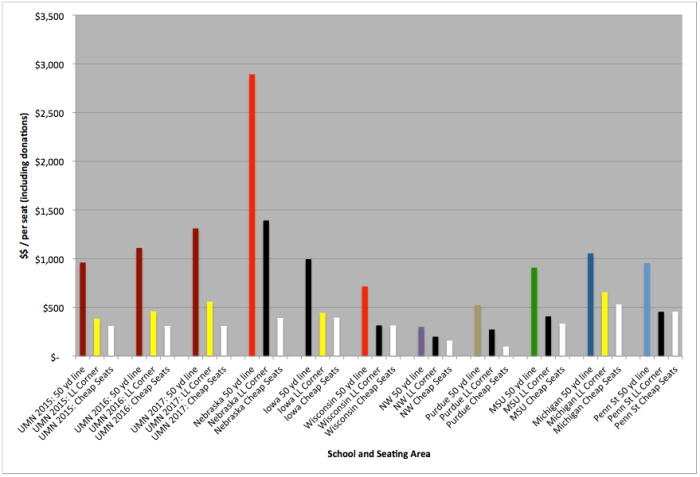
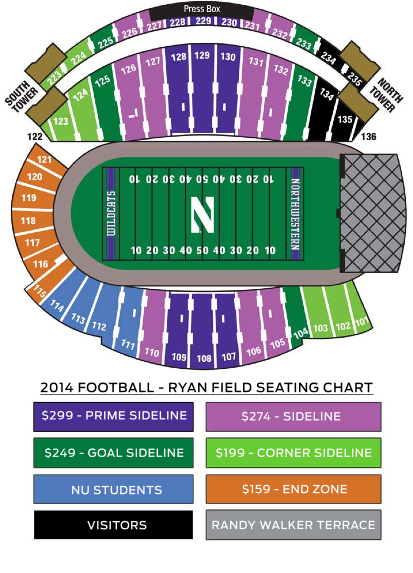
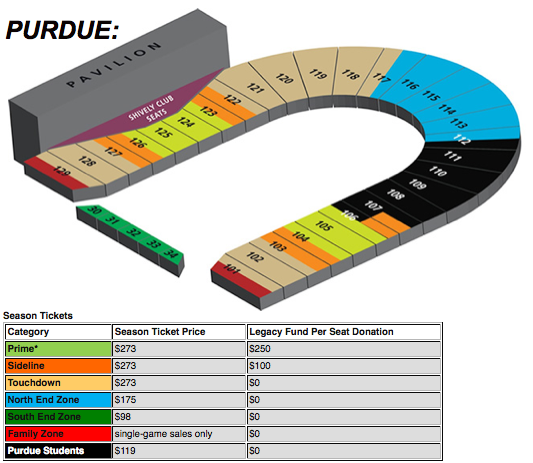
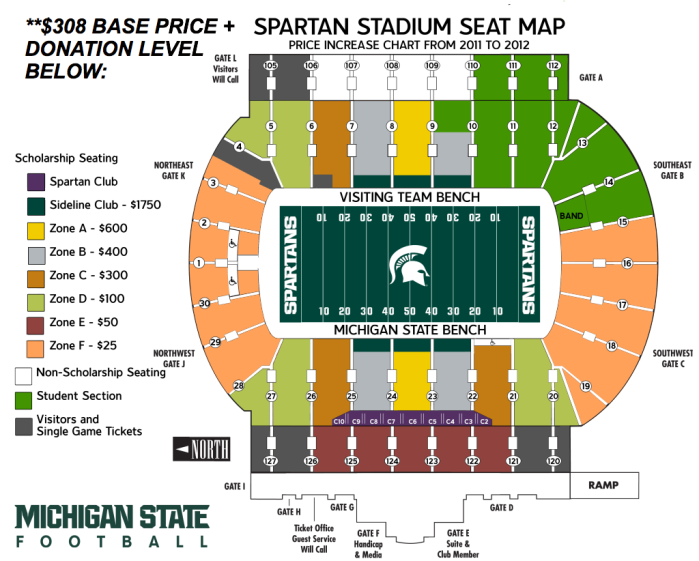
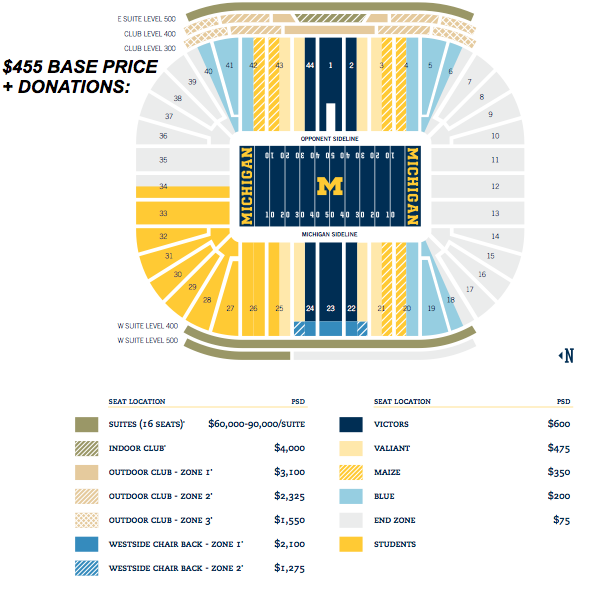
Let’s first look at a comparative chart, which is followed below by seating charts and pricing information for nine Big Ten Schools.

(All data pulled directly from the school/fundraising websites, sources in the comments below)

Comparative Chart:

Comparative prices

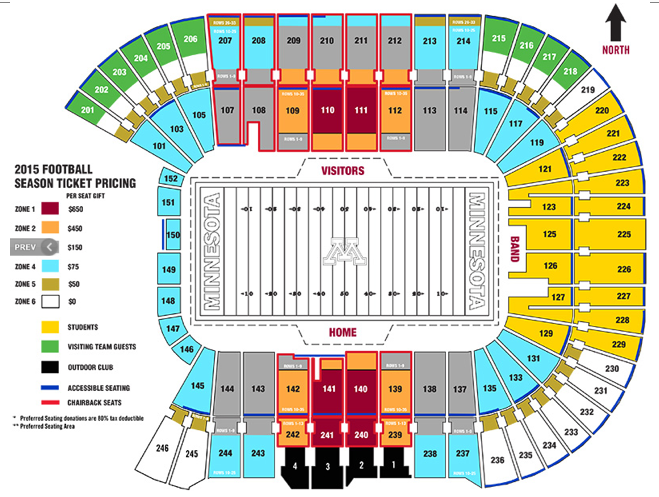
Minnesota Gophers – (Gophers prices do not include $310 base price):

2015 Prices:

Gophers 2015

2016 Prices:

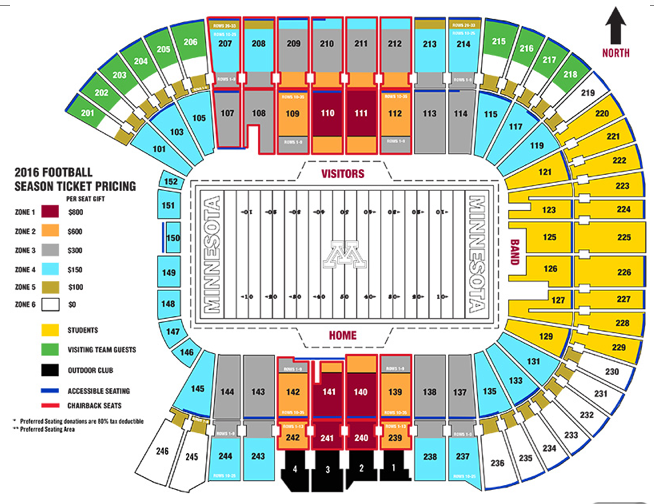
Gophers 2016

2017 Prices:

Gophers 2017

Nebraska (2014 Prices):

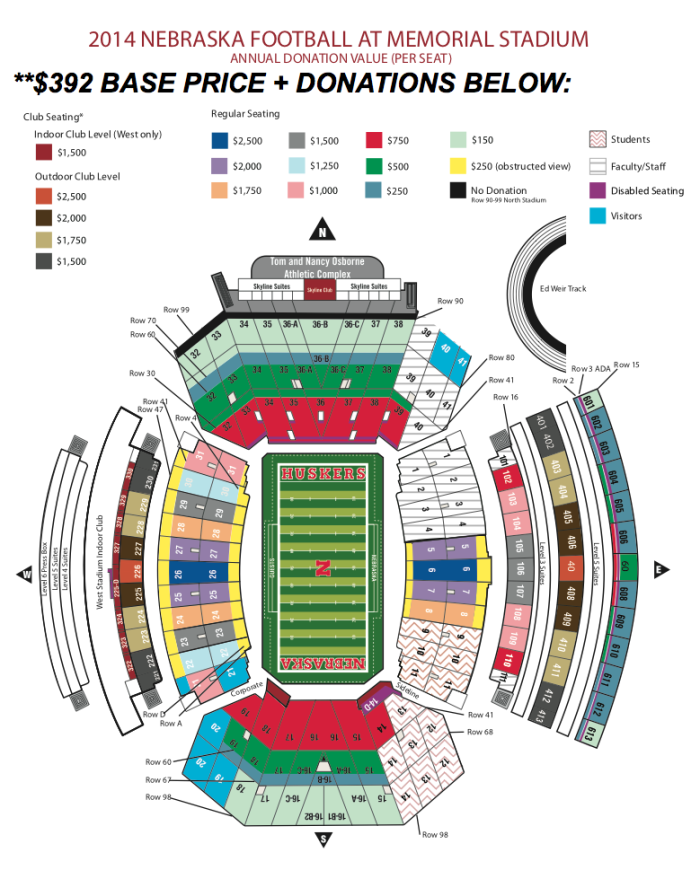
Nebraska

Iowa (2014 Prices):

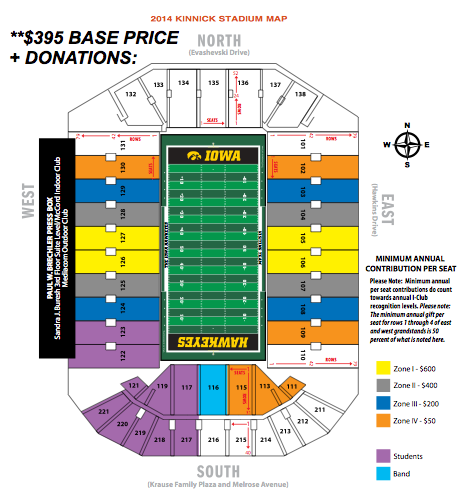
IOWA

Wisconsin (2014 prices):

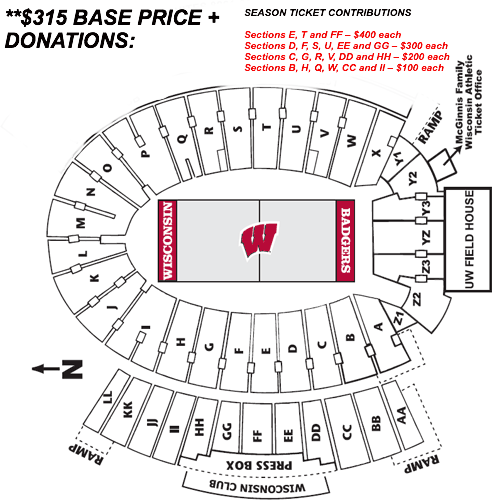
WISCONSIN

Northwestern (2014 Prices):

Northwestern

Purdue (2014 Prices):

PURDUE

East Division Teams:

Michigan State (2014 Prices – they have not changed since 2012):

Michigan_State

Michigan (2015 Prices):

MICHIGAN

Penn State (2015 Prices):

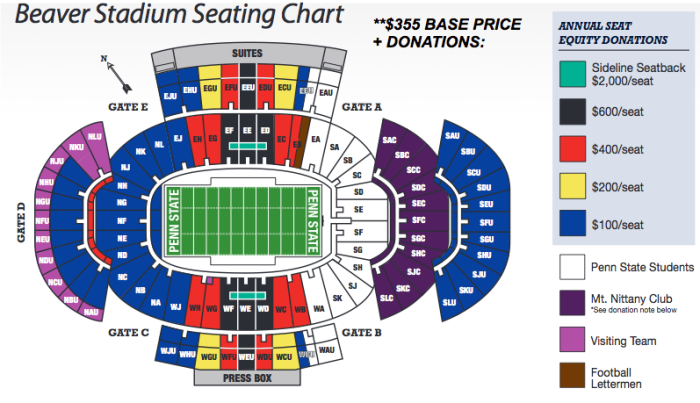
Penn_State

No one likes math, so I will follow up tomorrow with another post comparing prices in certain seating areas and insert some cool charts and stuff!

And remember my sources for charts and prices are in the comments below.

Updated B1G West Division Title Routes

After a 59-17 beat-down of Nebraska over the weekend the Badgers are now in a great position to win the B1G West Division title race. That being said, the Gophers control their own destiny, as a 2-0 finish would win them the division. Iowa wins the division with a 2-0 finish combined with a Gophers loss in one of their last two games. The chart is much simpler this week and the scenarios break down as follows:

CLICK HERE FOR THE SPREADSHEET —- B1G West Title Routes – UPDATED as of 11_16

Key Takeaways:
Minnesota and Wisconsin control their own destiny, as a 2-0 finish by either team would win the division.

Iowa needs to win both remaining games to win the division, along with a Gophers loss in one of their last two games as the Gophers hold the head-to-head tiebreaker.

If neither Minnesota or Iowa win out Wisconsin will win the division title, assuming they win one of their two remaining games.
There are no longer any scenarios in which the division could end up in a three-way tie.
After a 59-17 loss on Saturday Nebraska is in trouble. Their only hope for a division title involves Wisconsin losing both games, the Gophers and Hawkeyes both going 1-1, and winning their final two games themselves.

Routes to the B1G West Title (excluding 3-way ties)

I’ve uploaded a spreadsheet which includes all potential routes to the B1G West Title. Take a look:

UPDATE***: I fixed a few errors in the spreadsheet and in the article below. A previous version stated their were five “routes” to a 3-way tie when there are in fact only three routes to that result.

CLICK HERE TO DOWNLOAD SPREADSHEET WITH COLORS AND CHARTS AND STUFF: “B1G West Title Routes – UPDATED

Routes to the B1G West Title by team (excluding 3-way ties):
Nebraska 17
Minnesota 19
Wisconsin 17
Iowa 8
Routes assuming Nebraska beats Wisconsin, all else the same:
Nebraska 15
Minnesota 9
Wisconsin 2
Iowa 4
Routes assuming Wisconsin beats Nebraska, all else the same:
Nebraska 2
Minnesota 9
Wisconsin 15
Iowa 5
Key Gophers Takeaways
If the Gophers beat Ohio State this weekend Minnesota has 12 routes to a division title (excluding 3-way ties). If the Gophers lose they have 7 routes.
If the Gophers lose to Ohio State this weekend, all 7 routes to a title involve beating both Nebraska and Wisconsin on the road.
NEBRASKA VS WISCONSIN HAS HUGE IMPLICATIONS:
If Wisconsin beats Nebraska this weekend Wisconsin has 15 routes to a division title (excluding 3-way ties). If they lose they only have 2 routes.
If Nebraska beats Wisconsin this weekend Nebraska has 15 routes to a division title (excluding 3-way ties). If they lose they have 2 routes.
There are three*** scenarios in which the B1G West finishes in a three-way tie. Tiebreakers get incredibly complicated, but here are the rules pulled directly from the Big Ten website:

“(b)    If three or more teams are tied, steps 1 through 7 will be followed until a determination is made.  If only two teams remain tied after any step, the winner of the game between the two tied teams shall be the representative.
1.    The records of the three tied teams will be compared against each other.
2.    The records of the three tied teams will be compared within their division.
3.    The records of the three teams will be compared against the next highest placed teams in their division in order of finish (4, 5, and 6).
4.    The records of the three teams will be compared against all common conference opponents.
5.    The highest ranked team in the first College Football Playoff poll following the completion of Big Ten regular season conference play shall be the representative in the Big Ten Championship Game, unless the two highest ranked tied teams are ranked within one spot of each other in the College Football Playoff poll.  In this case, the head-to-head results of the top two ranked tied teams shall determine the representative in the Big Ten Championship Game.
6.    The team with the best overall winning percentage [excluding exempted games] shall be the representative.
7.    The representative will be chosen by random draw.”
If a 3-way tie were to occur the tiebreaker would move to #3 , as the teams involved in each of the scenarios would have head-to-head records of 1-1 and multiple teams (if not all 3) would have division records of 5-2.
The wording in “Tiebreaker 3” above is kind of ambiguous. Are the records of the three teams tied compared against the 4th place finisher? Or is the tie broken by comparing the teams’ cumulative records against the teams who finish 4-6?
It’s past midnight and I’m confused. We’ll fight that battle next week.