Unlike many new coaches, PJ Fleck is not coming into his new position as Head Coach with an empty cabinet, as the Gophers return most of their starters from a 9-4 team last year. However, determining what to expect from a record standpoint this year is difficult, especially given a new system will be in put in place and a new Quarterback will be learning on the job.
The inputs:
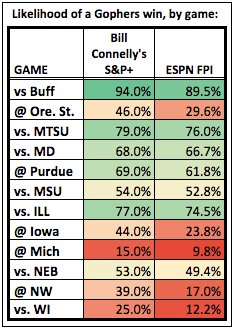
People often roll their eyes at or ignore statistics-based approaches, but their accuracy can be validated using historical game-by-game results. For this analysis I used two respected, predictive football models: Bill Connely’s S&P and ESPN’s Football Power Index (FPI).
Bill Connelly has written an excellent preview of the Gophers 2017 season, and his win probabilities are included at the bottom. ESPN’s FPI win probabilities can be found here. I have summarized them below for quick reference:
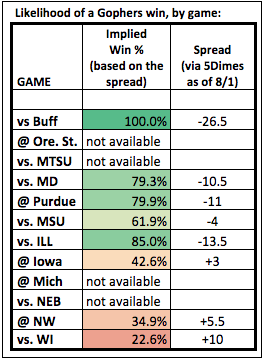
Further, Vegas spreads can be helpful in analyzing and setting preseason expectations. If a certain spread is “off” by more than a few points sharp bettors will put forward large bets until the spread shifts, thus becoming accurate. As of now spreads have been set for eight games this year.
vs. Wisconsin: +10
Based on the outcome of 17,000 games over multiple decades, spreads can be directly correlated to win probabilities. For example, six-point favorites win 66% of the time. Using the eight available spreads above I included the following win probabilities in my analysis, assuming that if the spreads were off by too much it would have adjusted already.
The method:
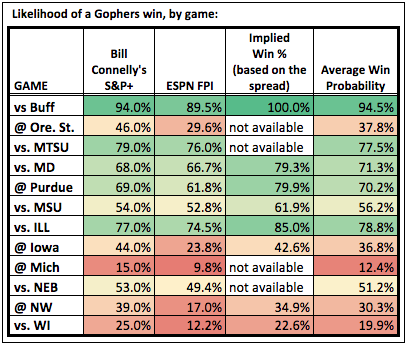
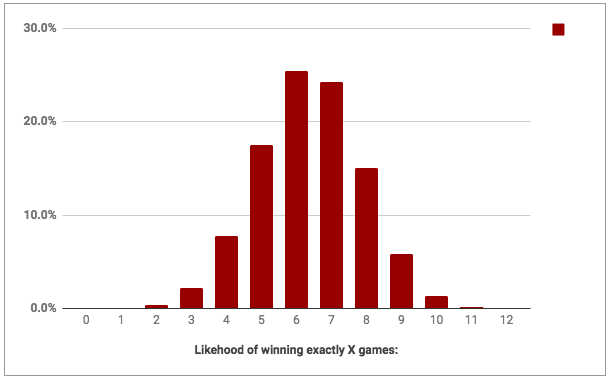
Given the concepts outlined above, I took game-by-game win probabilities from Bill Connelly’s S&P and ESPN’s FPI and combined those win probabilities with Vegas spreads to analyze the likelihood of various season-long outcomes.
Specifically, I calculated an “Average Win Probability” for each game by averaging each game’s win probability per ESPN’s FPI, per Bill Connelly’s S&P and per the spread (if available). The results of this are shown in the image below:
The results:
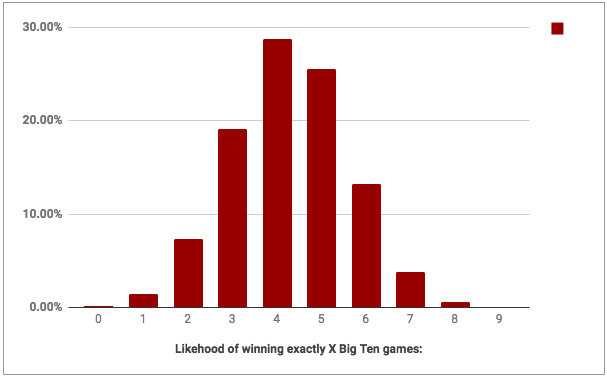
I then used the same approach to analyze the Big Ten portion of the schedule separately.
The takeaway:
To me the schedule can be broken down into three groups: should-be wins, toss ups and likely losses.
Should-be wins: Buffalo, vs. Middle Tennessee, vs. Maryland, at Purdue, vs. Illinois.
Toss ups: At Oregon State, vs. Michigan State, at Iowa, vs. Nebraska, at Northwestern.
Likely losses: At Michigan, vs. Wisconsin.
Whether this season can be labeled as a success will likely come down to the “toss up” games. For me, Big Ten play takes precedence over non-conference games, so the most important games on the schedule are Michigan State (projected to be down this year), Iowa and Nebraska.
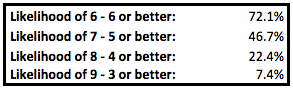
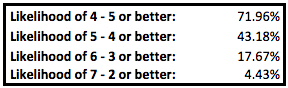
Switch those three games to wins in the model and the Gophers likelihood of winning eight or more games jumps from 22% to 64%. And the likelihood of nine wins or more jumps from 7% to 33%.
Win two or three of the games and the Gophers should be competing for a Big Ten West title as they enter the final two games, at Northwestern and vs. Wisconsin.
However, with losses at Iowa and vs. Nebraska the Gophers will quickly find themselves out of contention and instead competing for bowl eligibility.
Spreadsheet link for those curious:


